We’ve analysed the last 6 months of European funding and it’s a good time to be green
PS: Our newsletter subscribers got an exclusive preview of this data. You can join them, if you subscribe here.
We’ve analysed the last 6 months of European funding using current data from Crunchbase to put our fingers on the pulse of the investment landscape. It’s been a productive 6 months: $183 billion deployed across 4,921 transactions, including venture rounds, private equity, debt financing and more. Let us take you for a short ride for an overview of the most interesting facts we have dug up.
The five largest transactions are:
- Axpo Group, Swiss energy company, $7.6b debt facility
- Northvolt, Swedish battery developer, $5.0b debt facility
- Automotive Cells Company, French battery developer, $4.7b debt facility
- H2 Green Steel, Swedish green steel company, $4.6b debt facility
- PSG, French football team, $4.3b private equity round
We see debt dominating the top five, and this is true for the complete dataset as well. Of the €183b deployed, $118b was debt (almost 65% of total funding). As expected, the debt transactions were also the largest, on average. Private Equity took second place, with $26.2b deployed across 196 transactions. Venture came in at a comfortable third, with $23b deployed in total. As expected, Venture was the most active asset class, with over 2,200 transactions associated with early and late-stage venture.
Looking at the top five once more, we see one other thing. It appears it’s a good time to be in ClimateTech…
But is it really?
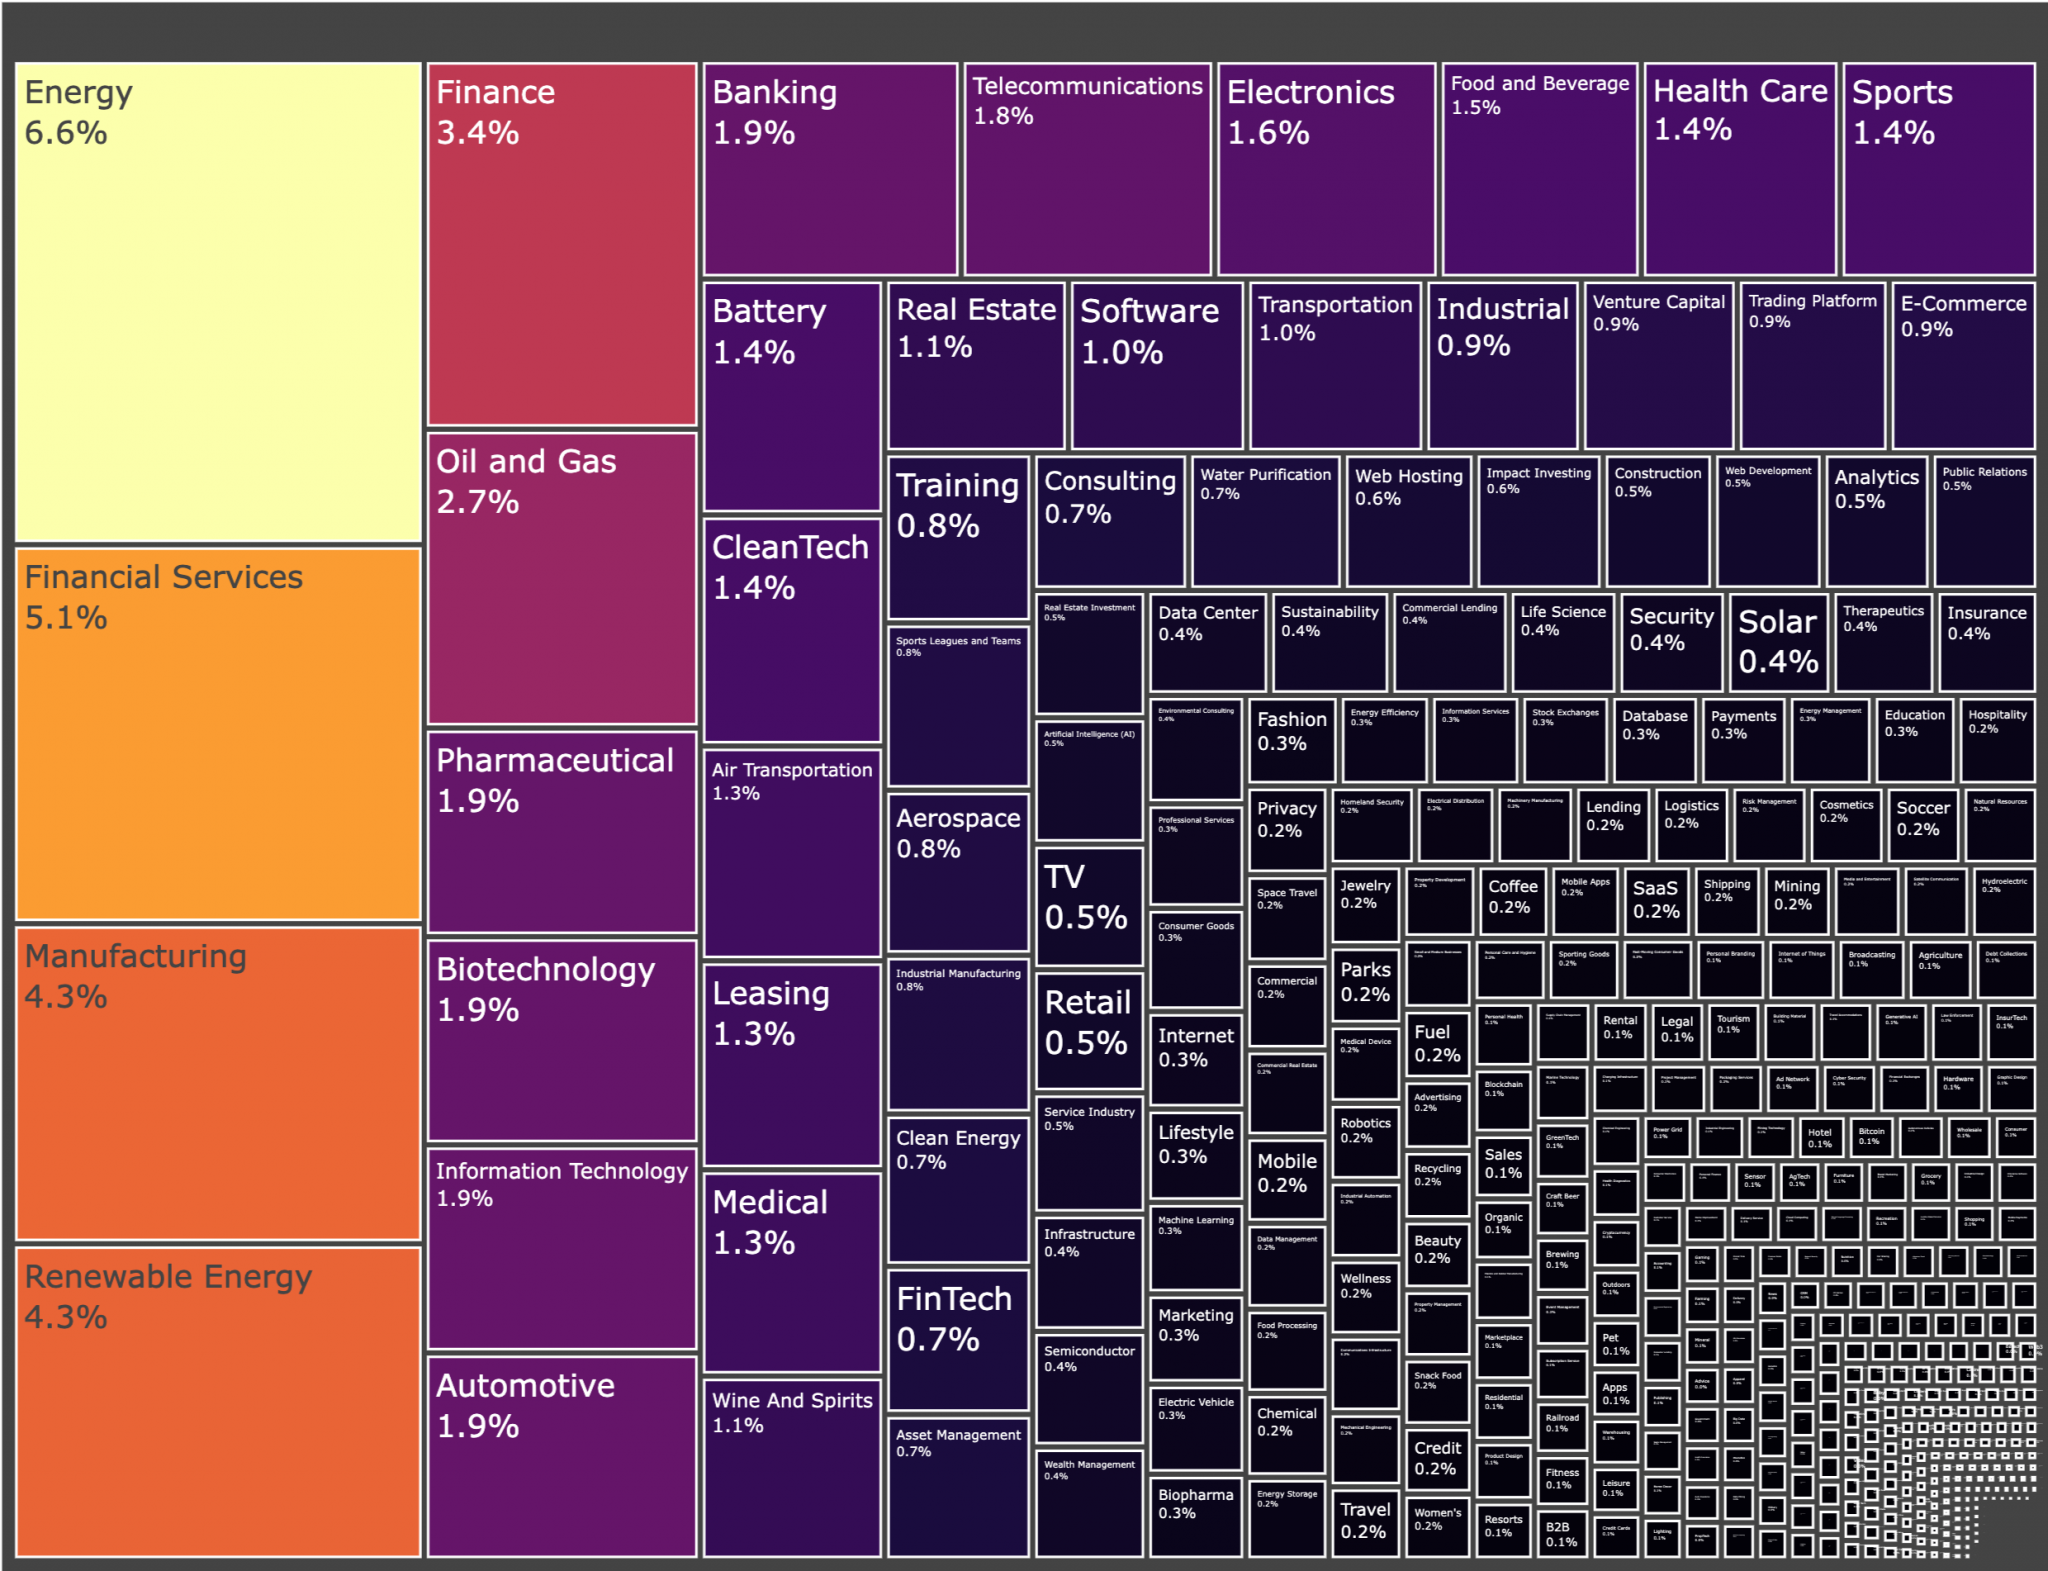
Looking at this sectoral breakdown of funding, we see that over 10% of financing went to energy and renewable energy alone. Manufacturing and CleanTech also take up some large proportions. Yet, financial services, finance, and oil and gas are also some of the largest areas to receive funding.
If we then look at the individual deals which made up all of this funding, we see how some larger transactions skew the distribution, i.e. Axpo pushing energy and renewable energy into the top.
Just a note on this graph. The Crunchbase data links transactions to many industries (e.g. Axpo appears in Renewable Energy and Energy). For these transactions, a transaction with three industries would appear with one third apportioned to each industry.
Which countries are the most active?
If we look at the data on a per country level, the UK is by far the most active market. It’s deployed the most capital and has the most transactions.
The UK has deployed $40b compared to France’s $26b and Germany’s $19b. However, the UK has smaller transactions, with the average deal worth half of France and Germany’s.
Looking at the ten most active countries, we see the UK, France and Germany at the top. However, Sweden and Switzerland are not far from third place – and punching well above their per capita weight class. Northvolt and H2 Green Steel are the drivers for Sweden. Those two transactions account for more than half of Sweden’s total deployed. Estonia maintains its reputation for Europe’s per capita unicorn hub, with a very strong performance putting it into the top ten.
Average round sizes and valuations
While this has been interesting so far, a lot of these transactions aren’t venture cases. Let’s take a deeper look at venture deals generally.
First, let’s look at the average valuations and round sizes*:
- Pre-Seed: €295k round, €2.0m pre-money
- Seed €1.9m round, €7.0m pre-money
- Series A €11.6m round, €30m pre-money
- Series B €25.5m round, €420m pre-money
- Series C+ €43.2m round, €510m pre-money
*converting USD to EUR at 1 USD = 0.92 EUR, data accurate as of 5th March
Looking at the distribution of rounds, we see a few things:
Firstly, the dataset is full of outliers. We believe this is a consequence of using Crunchbase, but doesn’t take away from the results themselves.
Secondly, we see a convergence in round sizes. High Pre-Seed rounds are comparable to low Seed ones. Similarly, the overlaps between subsequent rounds are clear. This fits with the increasingly larger rounds we’re seeing.
Waxing and waning sectors
Moving on from valuations, let’s look at where the capital is being deployed. The difference between sectoral allocation for early and late deals helps us spot trends. Early means Pre-Seed to Series-A. Late is Series-B onwards. The graph below shows the top 10 sectors by proportion of funding for early and late rounds.
Deals linked to AI (artificial intelligence, machine learning) represent 8% of early funding. Neither of these categories make the top 10 for late stage rounds.
It’s no surprise that they appear for early rounds. OpenAI has led to a paradigm shift in AI, and we’ve seen a boom in AI-linked funding. What’s interesting is this hasn’t progressed into the late rounds yet. We suspect there’s a 6-12 month lag until AI trickles down to the late stage.
Extending this logic, we can find the sectors which had the most change between early and late rounds. In the graph below, green bars are newcomers. These sectors received proportionally more funding in early rounds than late. Red bars are the opposite: These had a lower proportion in early rounds compared to later rounds.
Transportation, AI, and BioTech are the obvious winners. The proportion of early funding is double the proportion of late funding they received. Compare these to battery, industrial and aerospace: These had a high proportion in later rounds, but a much smaller proportion in early ones. Is this a sign that the market is shifting away from hardware intensive DeepTech?
Our bread and butter
Now that we’ve analysed all venture deals, we focus on PT1’s sweet spot: Pre-Seed, Seed, and Series-A deals across real assets and the built environment.
Overall, $1.9b was deployed across 322 transactions. The top 5 largest rounds include ecoworks, a PT1 PortCo at 4th place.
This $1.9b figure may seem small compared to the huge $183b total deployed. But we’re optimistic. Out of the $183b deployed, $8.8b went to early stage venture deals. This means over 20% of early stage venture rounds in the last 6 months went to startups in real estate, energy, infrastructure, or construction.
Now looking at the 5 largest rounds for each stage:
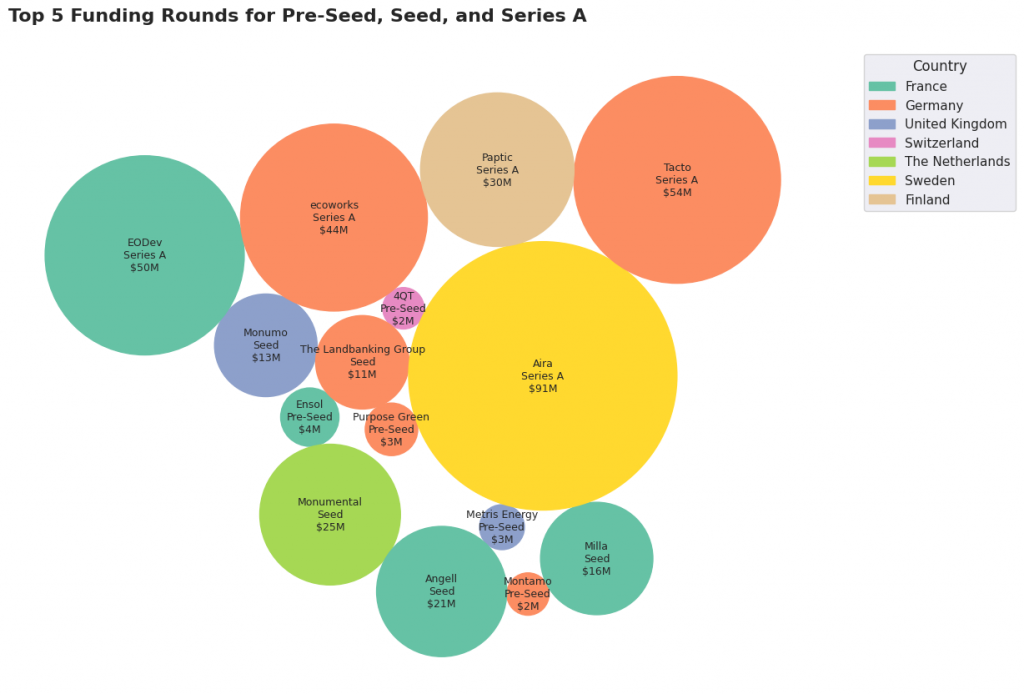
One thing the largest Pre-Seeds have in common: They are all heavily geared towards the green transition. Montamo and Purpose Green help residential houses decarbonise. Metris and Ensol are solar plays: for commercial and residential respectively. 4QT bucks the trend only slightly, as it aims to electrify heavy industrial vehicles.
At a country level, we see France and Germany dominating the Series-A and Seed sectors. We also see Sweden taking the largest round, with Aira’s Series-A. But is France and Germany’s prevalence common at all stages? Surprisingly, yes.
Germany has dethroned the UK for capital deployed. The UK is still top for number of transactions, but has fallen to third when ranking by capital deployed. The top three are unchanged: Germany, France and the UK. These top three are far in the lead, with a vast gulf between them and the next cluster: Sweden, Finland, Spain, Switzerland and the Netherlands.
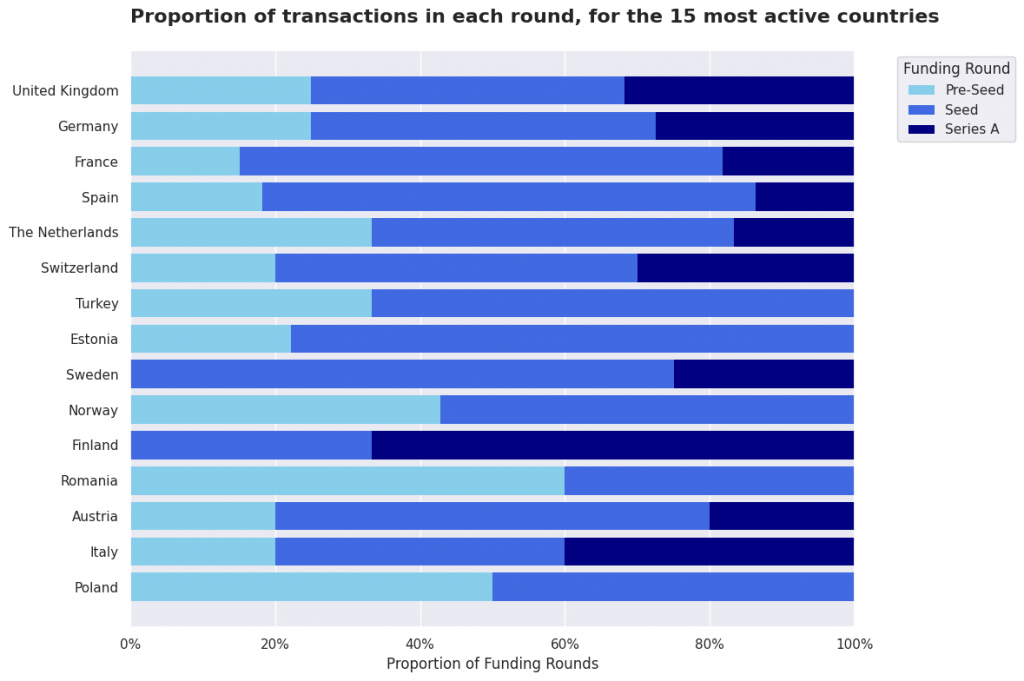
If we then look at the proportion of transactions between Pre-Seed, Seed and Series-A deals, we see that the UK and Germany have very similar profiles. I suspect this is down to their mature ecosystems. New companies are raising Pre-Seeds, and existing companies are getting to Series-A. Not every country has this profile: many lack Pre-Seeds or Series A’s.
Moving on from country analysis, let’s look at which sectors capital is being deployed to. Focusing on the built environment only allows us to be a lot more granular.
We see renewable energy, energy and CleanTech make up over 25% of funding. If we include GreenTech, battery, clean energy and energy storage, we get to a third of total funding. Energy is becoming the biggest part of built world funding. We’ve been saying this for a while, but now we have the numbers to show other investors agree.
Artificial intelligence is coming through. AI and ML make up close to 4% of the funding deployed. This is less than the 5.4% of funding across all Pre-Seed to Series-A rounds, but we’re not far off.
“Classic” PropTech and ConTech are dwarfed by the green transition. This is good news for early-stage investors: These areas might be undervalued.
Something that surprised us was the 1% of funding going to the semiconductor sector. This includes companies in the industrial energy transition, like Build to Zero and StackEase. We suspect this sector will grow, as we move from decarbonising housing to decarbonising industry.
We can also take a look at the largest Pre-Seed, Seed and Series-A rounds in our top ten countries.
Active investors
There are 236 active “lead investors” in this space. Many investors have elected to remain anonymous, but focusing on the ones we do know:
- Techstars is the most active, with 9 lead investments in the last 6 months in this space.
- 7 investors take second place, with 3 lead investments each.
- The most capital deployed is harder to assess, as Crunchbase doesn’t track the data we need. Through some back of the envelope calculations, we think Tilt Capital Partners takes it. This comes from their €46m lead investment in EODev, a French hydrogen fuel cell startup.
Takeaways, methodology and conclusion
The key facts to take with you:
- There have been 4.9k transactions deploying $183b, of which early stage venture takes $9b.
- Pre-Seed, Seed and Series-A built environment deals make up 1% of deployed capital ($1.9b) and 7% of transactions (322)
- The UK, Germany and France are the most active countries with healthy activity at all deal stages
- Techstars is the most active investor in this sector
- The average Pre-Seed, Seed and Series-A rounds are:
- €295k round, €2.0m pre-money,
- Seed €1.9m round, €7.0m pre-money,
- Series A €11.6m round, €30m pre-money.
This is our first time publishing this analysis. Prior to this, our analysis has always been an internal tool to put our finger on the pulse of European funding. If there any other datapoints you’d like to see, or if you have any questions – get in touch at burhan@pt1-x4esqo78i0.live-website.com.
All data is from Crunchbase; PT1 is responsible for all graphs and analysis.